With an Eye on the Aesthetics
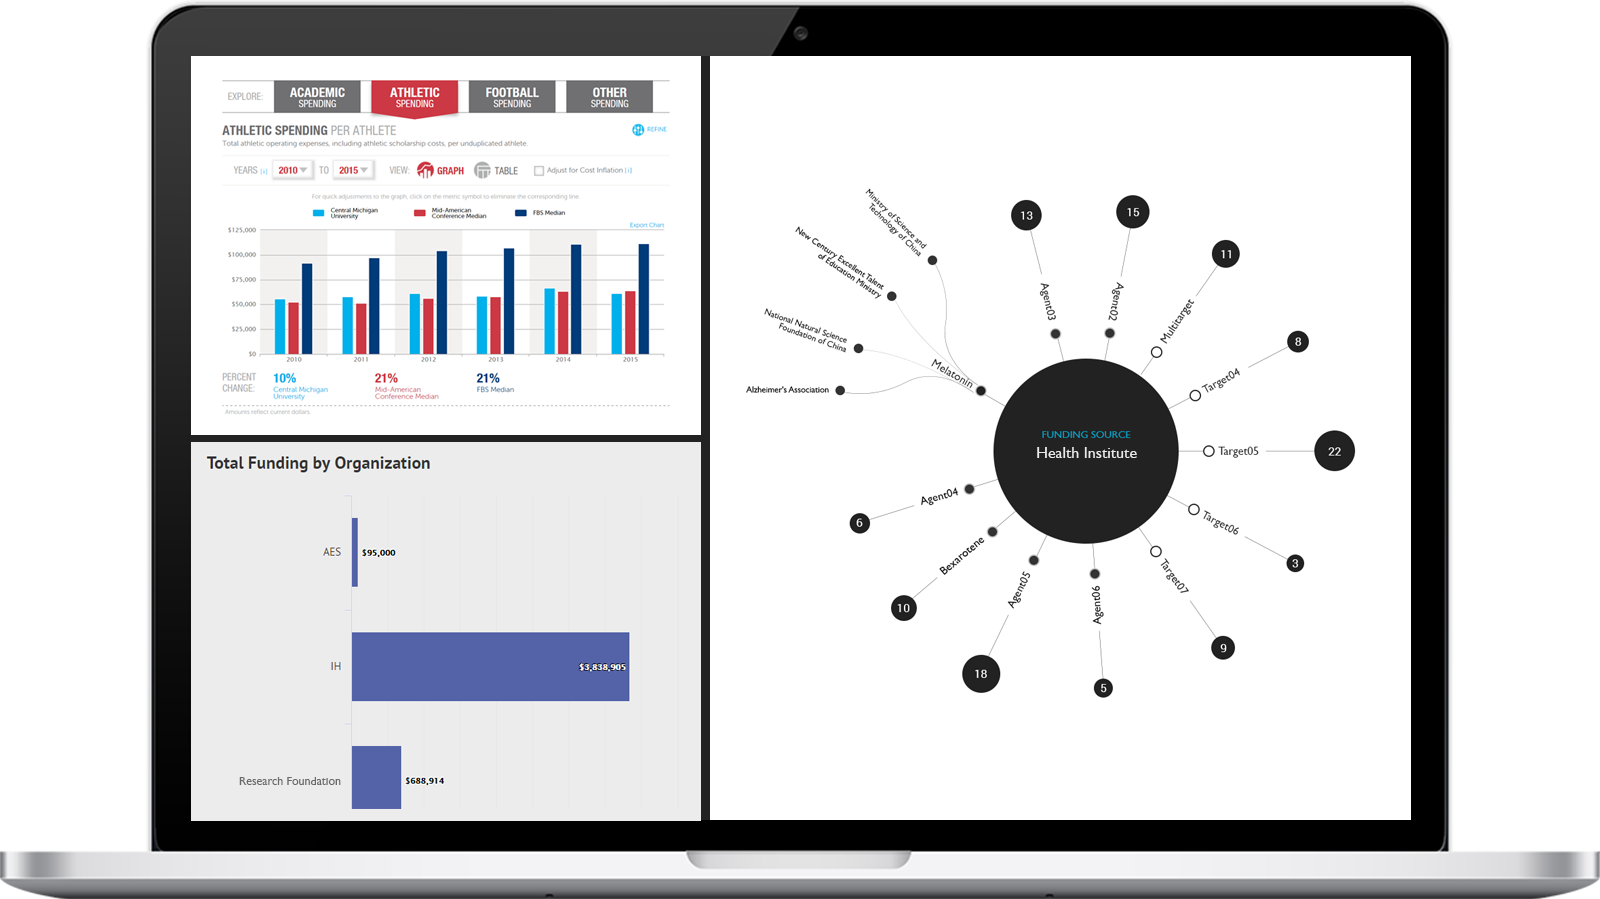
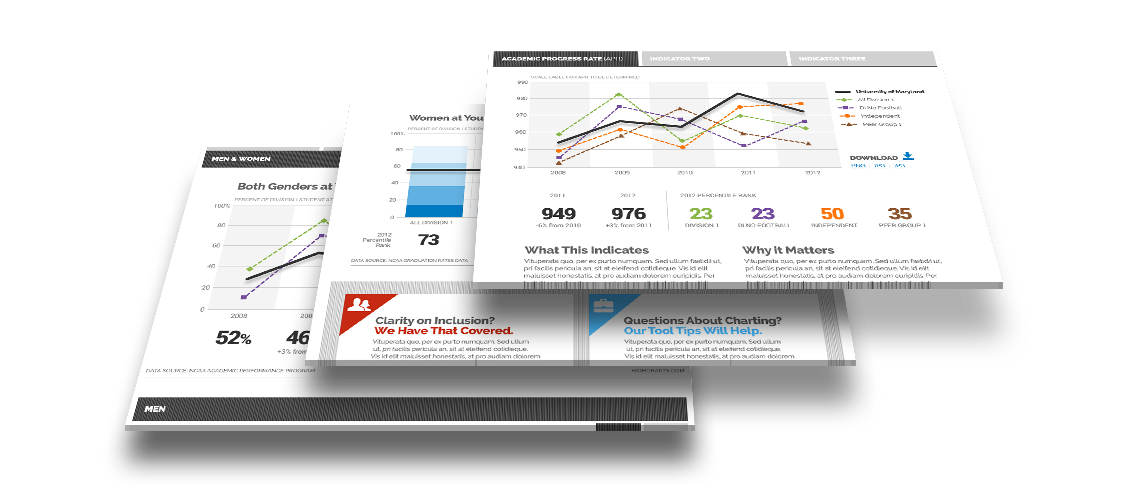
Data Visualization encompasses many disciplines – involving the creation and study of the visual representation of Data. By creating clean and engaging charts, graphs or maps to visualize large amounts of complex data, the human brain can process this data more efficiently and easily. With our strong UX/UI design process, we communicate the data with optimal effectiveness.
Informatics
Where does informatics Come in? The term “informatics” broadly describes the study and practice of creating, storing, finding, manipulating and sharing information. We’ve been highly successful creating sites that allow researchers to search biomedical information, find a dataset and then visualize the data to create a deeper understanding of how research dollars are spent.